ARCHIVED – Canada’s Energy Future 2017 Supplement: Conventional, Tight, and Shale Oil Production
This page has been archived on the Web
Information identified as archived is provided for reference, research or recordkeeping purposes. It is not subject to the Government of Canada Web Standards and has not been altered or updated since it was archived. Please contact us to request a format other than those available.
Canada’s Energy Future 2017 Supplement: Conventional, Tight, and Shale Oil Production [PDF 2125 KB]
Report Data and Figures [EXCEL 141 KB]
Appendix Data and Figures [EXCEL 11159 KB]
January 2018
Copyright/Permission to Reproduce
ISSN 2369-1479
Table of Contents
Chapter 1: Background
The National Energy Board’s (NEB) Energy Futures (EF) series explores how possible energy futures might unfold for Canadians over the long term. EF analysis considers a range of impacts across the entire Canadian energy system. In order to cover all aspects of Canadian energy in one supply and demand outlook, crude oil and natural gas production analysis can only be addressed at a relatively high level. Supplemental crude oil and natural gas production analyses address impacts specific to the supply sector, creating an opportunity to provide additional detail and to expand the number of cases to cover greater volatility in crude oil and natural gas prices and in supply-side technology assessment.
Future oil prices are a key driver of future oil production and a key uncertainty to the projections in the Canada’s Energy Future 2017: Energy Supply and Demand Projections to 2040 (EF2017). Crude oil prices could be higher or lower depending on demand, technology, geopolitical events, and the pace at which nations enact policies to reduce GHG emissions.
EF analysis assumes that over the long term all energy produced, given the pricing conditions of the case, will find markets and infrastructure will be built as needed to move that energy to markets. The timing and extent to which particular markets emerge, whether demand growth over/undershoots local production, whether export/import opportunities arise, and whether new infrastructure for crude oil is built, are difficult to predict. This is why simplifying assumptions are made. The analysis in this supplemental report continues the EF tradition of assuming these short-term disconnects are resolved over the longer term.
EF series Natural Gas and Crude Oil Production Supplemental Reports include six cases: the three EF2017 cases, and three additional cases that further analyze oil and gas production in Canada.
Table 1.1 EF2017 Natural Gas and Crude Oil Production Supplements Assumptions/Cases
| Variables | EF2017 | Additional Cases | ||||
|---|---|---|---|---|---|---|
| Reference | Higher Carbon Price | Higher Carbon Price + Technology | Reference + Technology | High Price | Low Price | |
| Oil Price | Moderate | Moderate | Moderate | Moderate | High | Low |
| Gas Price | Moderate | Moderate | Moderate | Moderate | High | Low |
| Carbon Price | Fixed nominal C$50/t | Increasing CO2 cost reaching nominal C$140/t in 2040 | Increasing CO2 cost reaching nominal C$140/t in 2040 | Fixed nominal C$50/t | Fixed nominal C$50/t | Fixed nominal C$50/t |
| Technology Advances | Reference assumption | Reference assumption | Accelerated | Accelerated | Reference assumption | Reference assumption |
| Notes | Based on a current economic outlook and a moderate view of energy prices | Considers the impact on the Canadian energy system of higher carbon pricing | Considers the impact of greater adoption of select emerging energy technologies on the Canadian energy system, including technological advances in oil sands production | Since price is one of the most influential factors in oil and gas production, and does vary over time, these two cases look at the effects of significant price differences on production | ||
This Canadian conventional, tight, and shale oil productionFootnote 1 supplemental report includes a detailed look at the Reference Case, followed by results from the other five cases. The acceleration in technological advances that applies to energy supply in the technology cases is a focus on advancements in solvent use oil sands production technologies with no changes to other oil production technology assumptions. Oil price assumptions in the High Price Case and Low Price Case differ significantly from the other four cases.
The Appendix includes a description of the methods and assumptions used to derive the production projections, and detailed data sets for all cases – including annual wells drilled, production decline curve parameters, and monthly production, all by grouping. The Appendix , data from the Appendix [EXCEL 10014 KB], and Chart data [EXCEL 140 KB] are available.
Chapter 2: Reference Case
2.1 Conventional, Tight and Shale Oil Production by Province
- Figure 2.1 shows production by province in the Reference CaseFootnote 2. Oil prices have been significantly lower in the last couple of years compared to 2010 to 2014, leading to a decline in total production. Starting this year, prices are expected to gradually increase and reach US$80/bbl in 2027 for Brent crude. Western Canadian industry activity will pick up as oil prices rise and this will eventually lead to production increasing as production added from new wells starts to outpace declining production from existing wells. Production in western Canada in 2016 was 154 thousand cubic metres per day (10³m³/d) or 0.97 million barrels per day (MMb/d) and by 2040 it will be 36% higher at 210 10³m³/d (1.32 MMb/d).
Figure 2.1 Reference Case Non-Oil Sands Production and Price
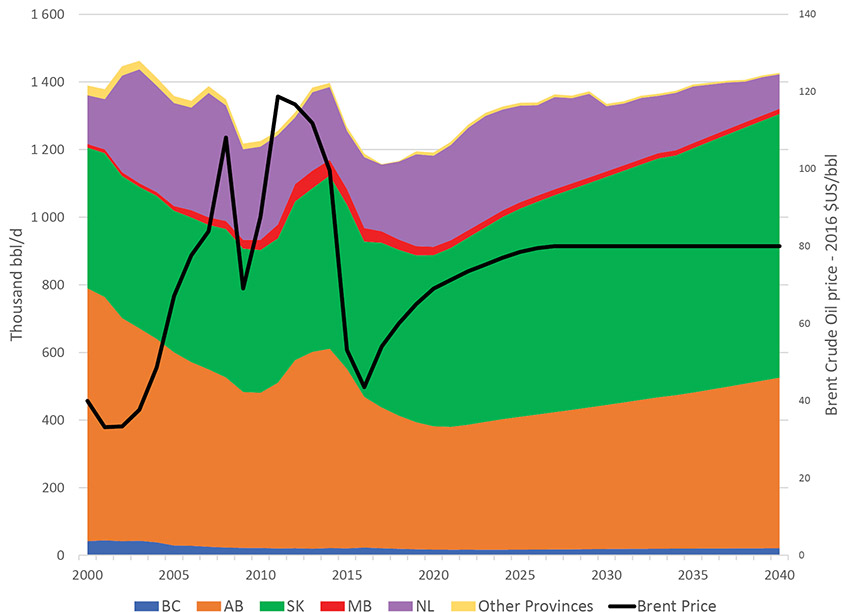
Description:
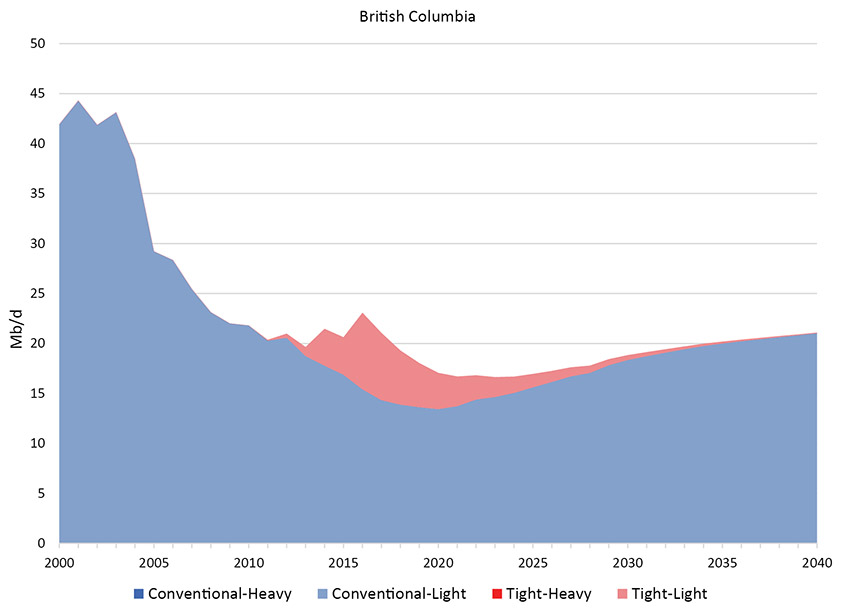
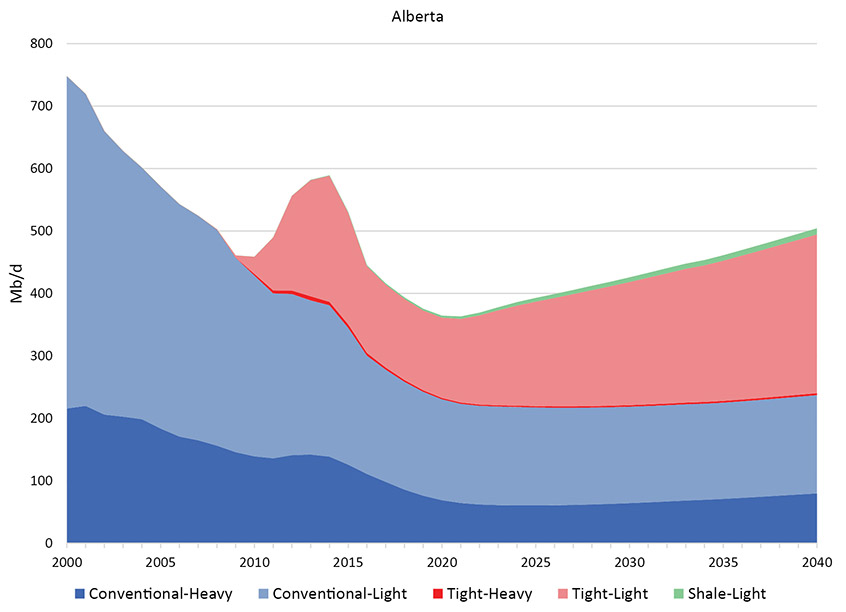
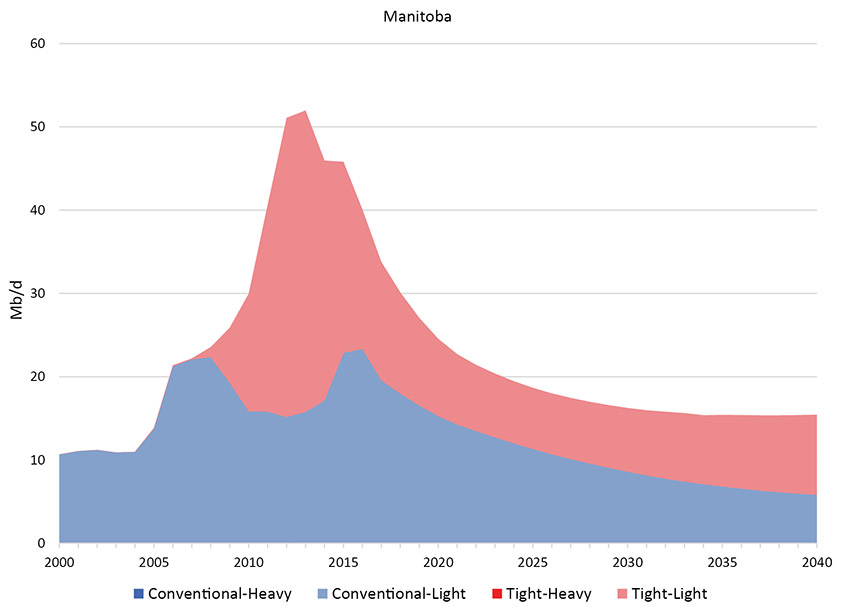
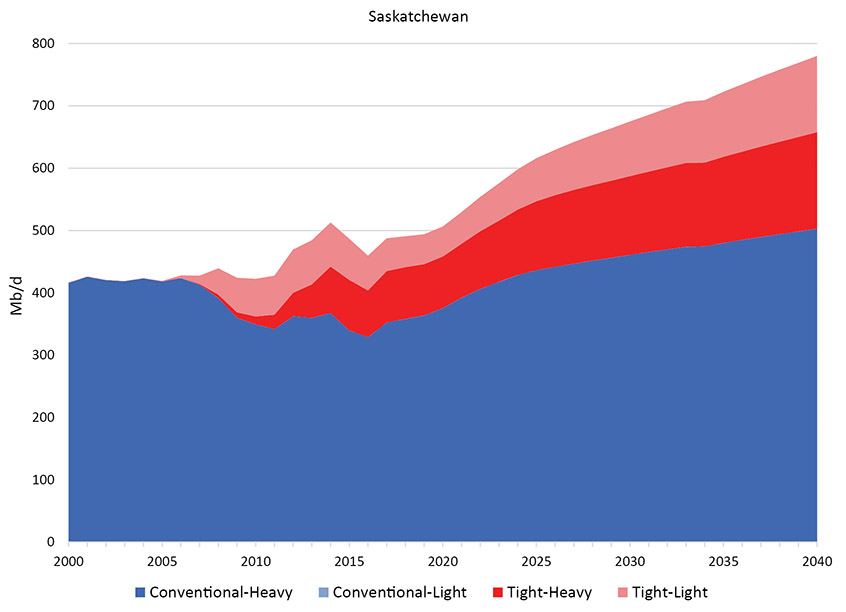
This graph breaks down the Reference Case projection for Canadian conventional, tight, and shale oil production by province, and also includes the Brent crude oil price. British Columbia oil production is projected to decrease from 23.08 Mb/d in 2016 to 21.10 Mb/d in 2040. Alberta production is projected to increase from 445.33 Mb/d in 2016 to 504.24 Mb/d in 2040. Saskatchewan is projected to increase from 459.45 Mb/d in 2016 to 780.14 Mb/d in 2040. Manitoba is projected to decrease from 40.08 Mb/d in 2016 to 15.44 Mb/d in 2040. Newfoundland is projected to decrease from 209.66 Mb/d in 2016 to 101.81 Mb/d in 2040. Production for the rest of Canada is projected to decrease from 9.78 Mb/d in 2016 to 4.05 Mb/d in 2040. Total Canadian production is projected to increase from 1187.40 Mb/d in 2016 to 1426.78 Mb/d in 2040. The Brent crude oil price, in 2016 U.S. dollars per barrel, is projected to increase from $43.50 in 2016 to $80.00 in 2027 and remain at $80.00 to the end of 2040.
- 2016 was the first year that Saskatchewan production surpassed Alberta non-oil sands production. This continues over the projection period and by 2040 Saskatchewan makes up 55% of total production. Saskatchewan production growth largely comes from thermal heavy oil projects (section 2.3 provides more details).
- British Columbia (B.C.) and Manitoba produce minor amounts of both conventional and tight oil. The provincial breakdowns are in the next section.
- Conventional oil is produced elsewhere in Canada. Newfoundland and Labrador offshore oil production increases steadily over the next five years as the Hebron project begins production and additional wells are brought online at existing facilities. After peaking at 49 10³m³ /d (309 Mb/d) by 2023, production begins to decline as operating fields mature. The Reference Case assumes that two generic offshore discoveries add new production starting in 2027 and 2033. Northern Canada and Ontario oil production continues to trend down over the projection period. Nova Scotia has condensate production, which is not included in this report.
2.2 Western Canadian Production by Province, Class, and Type of Oil
- Since 2000, production by class of non-oil sands oil ranged from 49% to 58% heavy, with the remainder lightFootnote 3. In 2016, heavy oil made up 54% of production and is projected to climb to 59% in 2021 and 2022 with the ramp-up of Saskatchewan thermal heavy oil projects. Heavy oil production then drops down to 56% by 2040 as production from those projects levels off and growth in light oil outpaces growth in heavy oil. Both total heavy and total light oil production grow over the projection period after 2020, as well as conventional, tight, and shale production Footnote 4; however, there are differences for each province Footnote 5.
- Northeastern B.C. production is all light oil, with conventional oil making up the majority. While B.C. has substantial shares of Canadian natural gas production and resources (see Energy Futures 2017 – Natural Gas Production Supplemental Report), it does not have a significant amount of oil production.
- The majority of non-oil sands production in Alberta has and will continue to be light oil; most of the production growth over the projection period is from west-central parts of the province. As horizontal drilling and multi-stage hydraulic fracturing advanced over the last decade, tight oil production increased and will continue to make up a larger share. In 2016, conventional oil made up 67% of non-oil sands production in Alberta, by 2040 that share drops to 47%, tight oil’s share increases to 51% and shale oil is the remainder.
- Heavy conventional oil makes up the majority of Saskatchewan production and grows substantially over the projection period given projected thermal heavy oil growth (see section 2.3). Tight oil production will also continue in Saskatchewan because of tight oil development in the southwest and southeast parts of the province.
- Manitoba production is entirely light oil. Manitoba light, tight oil production peaked in 2012 and 2013, and has since declined. However it will increase slightly later in the projection period as prices rise and stay high enough for new production to outpace production declines from existing wells. Conventional oil production will decline over the projection period.
Figure 2.2 Reference Case Production by Class, Type, and Province
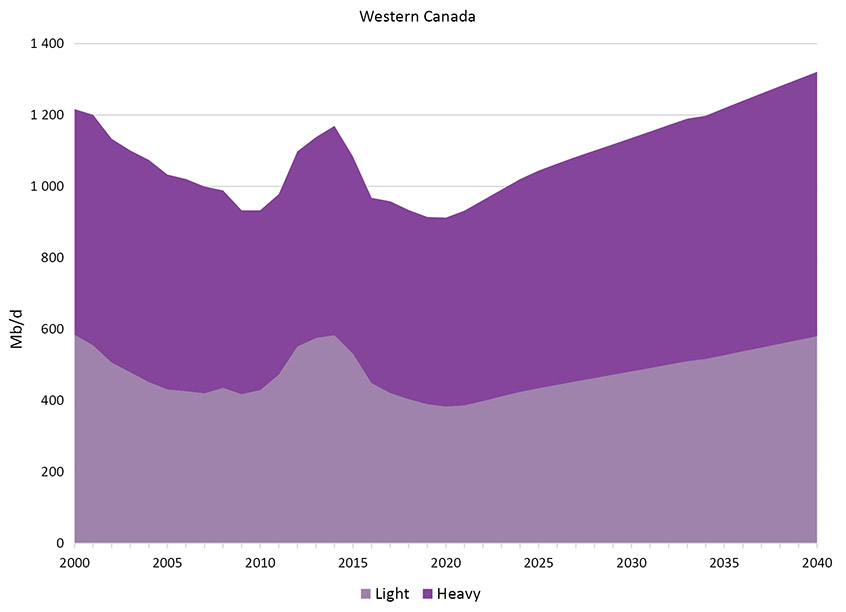
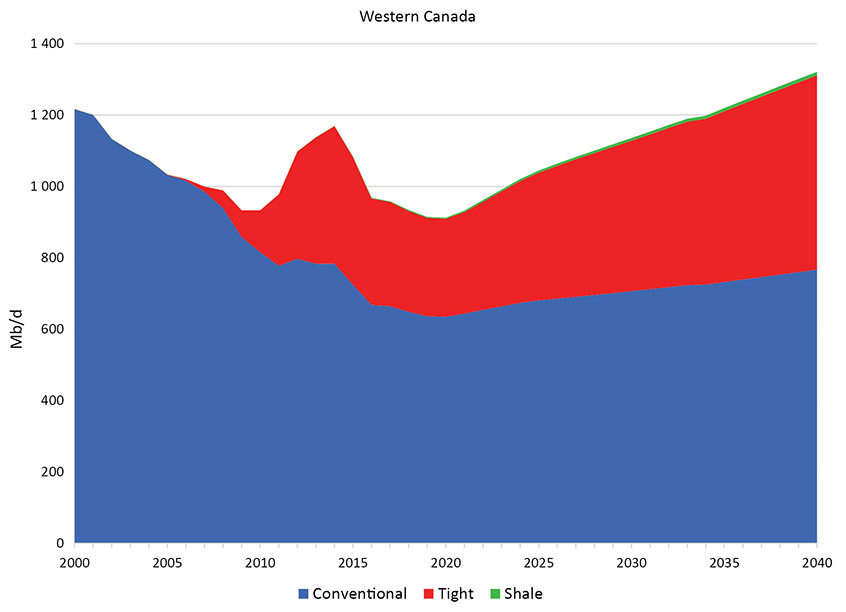
Description:
This graph breaks down the Reference Case projection for western Canadian conventional, tight, and shale oil production by province, by class of oil, and by type of oil. Total western Canada light oil production is projected to increase from 448.74 Mb/d in 2016 to 580.16 Mb/d in 2040. Total western Canada heavy oil production is projected to increase from 519.20 Mb/d in 2016 to 740.75 Mb/d in 2040. Total western Canada conventional oil is projected to increase from 668.09 Mb/d in 2016 to 767.10 Mb/d in 2040. Total western Canada tight oil production is projected to increase from 298.36 Mb/d in 2016 to 544.14 Mb/d in 2040. Total western Canada shale oil production is projected to increase from 1.50 Mb/d in 2016 to 9.67 Mb/d in 2040. British Columbia light conventional oil is projected to increase from 15.42 Mb/d in 2016 to 21.03 Mb/d in 2040. British Columbia light tight oil is projected to decrease from 7.66 Mb/d in 2016 to 0.07 Mb/d in 2040. Alberta heavy conventional oil is projected to decrease from 110.97 Mb/d in 2016 to 79.87 Mb/d in 2040. Alberta heavy tight oil is projected to decrease from 4.46 Mb/d in 2016 to 3.14 Mb/d in 2040. Alberta light conventional oil is projected to decrease from 189.44 Mb/d in 2016 to 157.36 Mb/d in 2040. Alberta light tight oil is projected to increase from 138.97 Mb/d in 2016 to 254.20 Mb/d in 2040. Alberta light shale oil is projected to increase from 1.50 Mb/d in 2016 to 9.67 Mb/d in 2040. Saskatchewan heavy conventional oil is projected to increase from 328.89 Mb/d in 2016 to 503.01 Mb/d in 2040. Saskatchewan heavy tight oil is projected to increase from 74.89 Mb/d in 2016 to 154.73 Mb/d in 2040. Saskatchewan light conventional oil is less than 0.01 Mb/d. Saskatchewan light tight oil is projected to increase from 55.67 Mb/d in 2016 to 122.40 Mb/d in 2040. Manitoba light conventional oil is projected to decrease from 23.37 Mb/d in 2016 to 5.83 Mb/d in 2040. Manitoba light tight oil is projected to decrease from 16.71 Mb/d in 2016 to 9.61 Mb/d in 2040.
Saskatchewan Thermal and EOR Projects
- Growth in Saskatchewan conventional heavy oil production is from advancements in employing steam assisted gravity drainage recovery (SAGD) to heavy oil fields. There are currently 15 thermal heavy oil projects operating in Saskatchewan, a nearly threefold increase from 2012. Similar to the oil sands, production from these thermal projects does not exhibit the steep decline rates typical of traditional heavy oil wells. This generates revenues that enable ongoing capital expenditures and continued production growth over the projection period. Changes in market conditions, technology, or other factors could lead to production varying from this projection, especially for the later years.
- Enhanced Oil Recovery (EOR) methods have long been used in Saskatchewan for secondary extraction. Production from existing projects, such as the CO2 EOR projects currently operating in Weyburn and Midale, is starting to slowly taper off, and this trend is expected to continue over the projection period.
Figure 2.3 Thermal and EOR Oil Projects
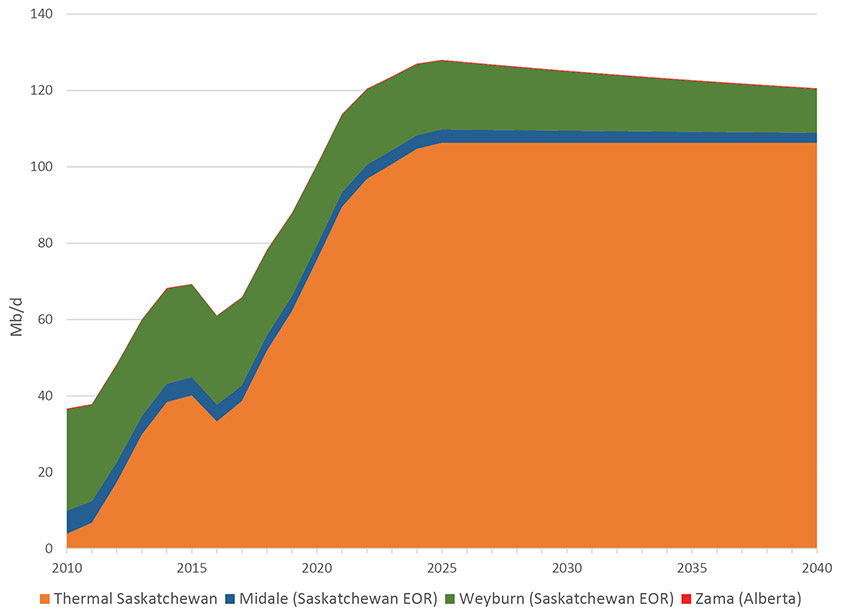
Description:
This graph shows the Reference Case production projection for Thermal and EOR in Saskatchewan and the Zama region of Alberta. Growth from this sector is largely due to increases in thermal oil production due to the application of SAGD technologies to conventional heavy oil reservoirs in the Lloydminster area of Saskatchewan. Thermal Saskatchewan production increases from 33.33 Mb/d in 2016 to 106.3 Mb/d in 2025 and stays level afterwards. Midale production decreases from 4.4 Mb/d in 2016 to 2.6 Mb/d in 2040. Weyburn production decreases from 23.2 thousands bbl/d in 2016 to 11.5 Mb/d in 2040. Zama, in Alberta, increases from 0.14 Mb/d in 2016 to 0.20 Mb/d in 2040.
2.4 Western Canada Average Days to Drill a Well and Initial Productivity
- Given the increased use of horizontal drilling and multi-stage hydraulic fracturing over the last decade, the average number of days to drill an oil well Footnote 6 in western Canada has, for the most part, increased until recently. In 2006 it took an average of 8.0 days to drill and complete a well, and in 2015 it reached 10.3 days. By 2016 the average returned to 8.0 drill days per well due to the focus on thermal heavy oil projects in Saskatchewan which typically take only a few days to drill, continued drilling efficiency gains, and lower prices causing reduced drilling activity for tight oil and other oil wells. The projected days per well stays fairly level over the projection period, with the effects of more thermal heavy oil development in Saskatchewan balanced out by more conventional and tight drilling as the oil price rises Footnote 7.
- Greater focus on developing tight oil has also increased the average initial production (IP) rate of wells in western Canada. The average IP was the lowest in 2006 at 41 b/d as many shallow, vertical wells were being drilled, which generally produce less than deeper wells. The average IP for all wells drilled in western Canada increased to 87 b/d by 2015. The average IP in 2016 was 69 b/d and stays level until 2025. IP’s decline slowly from then on as the resource matures and operators must move to non-core Footnote 8 areas as core acreages become fully developed.Footnote 9
Figure 2.4 Western Canada Average Well IP and Drill Days per Well by Year Footnote 10
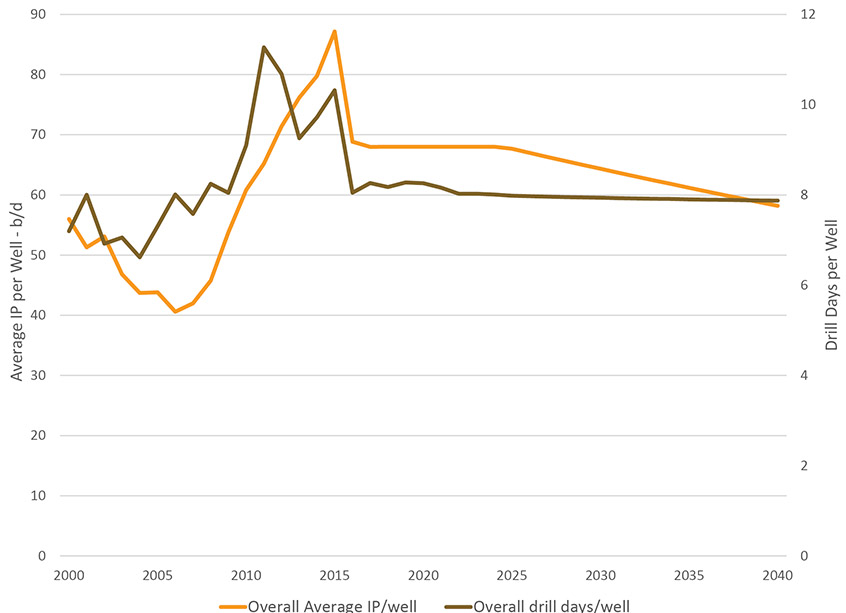
Description:
This graph includes the average initial production rate and average days to drill for all conventional, tight, and shale oil wells drilled in western Canada. The average IP for wells drilled in 2000 was 56 b/d. In 2016 the average was 69 b/d and is projected to decrease to 58 b/d in 2040. The average days to drill a well in 2000 was 7.2. In 2016 the average was 8.05 days and is projected to decrease to 7.87 days in 2040.
Chapter 3 – All Cases
- Production varies between the cases, especially for the High and Low Price cases. All cases have the same trend of focusing on tight oil resources and thermal heavy oil projects in Saskatchewan.
- In all cases except for the Low Price Case and Higher Carbon Price + Technology Case, declining production eventually bottoms out before increasing towards the end of the projection period. Production in the Low Price Case declines over the entire projection while production in the Higher Carbon Price + Technology Case only increases over the next decade as the production from thermal projects in Saskatchewan grows. In these two declining cases, oil prices are not high enough to enable sufficient capital expenditures to drill the new wells required to outpace production declines from older wells, and total production declines. In the Low Price Case, production drops to 53 10³m³/d (0.3 MMb/d) in 2040 – a quarter of the amount in the Reference Case.
- Production in the High Price Case reaches 402 10³m³/d (2.5 MMb/d) in 2040, twice as much as the Reference Case. This is largely from a compounding effect over the duration of the projection, where higher prices generate more revenue to enable more drilling and more production Footnote 11. Projected production from thermal projects in Saskatchewan is also higher than in the Reference Case.
- In the two higher carbon price cases, higher carbon costs and lower crude oil prices result in conventional production growing slower than in the Reference Case. Production in the Reference + Technology Case is lower than in the Reference Case because lower oil prices and technology improvements were only applied to oil sands with no changes to conventional, tight, and shale oil technology between the two cases.
- In the High Price Case increased investment leads to new East Coast offshore discoveries, the first of which occurs in 2024, three years earlier than in the Reference Case. Two additional discoveries occur in 2027 and 2030; total production from all offshore facilities peaks at 61.4 m³/d (386 Mb/d) in 2025. In the Low Price Case production peaks at 49.1 m³/d (309 Mb/d) in 2023 with no new offshore discoveries due to persistent low prices.
Figure 3.1 Oil Price and Production Projections by Case
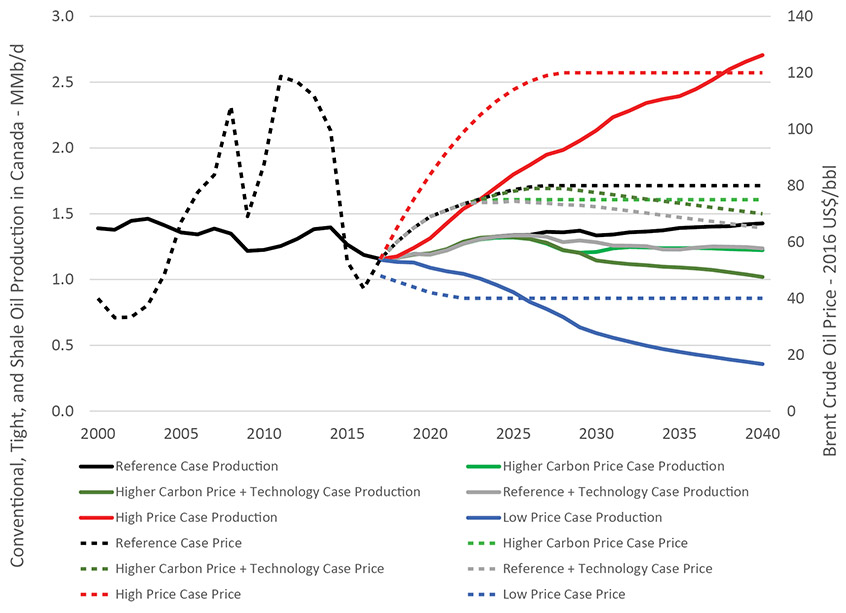
Description:
This graph shows the projections for Canadian conventional, tight, and shale oil production and Brent crude oil price for all six cases. The oil price is in 2016 US dollars per barrel. In the Reference Case price is projected to increase from $43.50 in 2016 to $80.00 in 2040, and production is projected in increase from 1.19 million b/d in 2016 to 1.43 million b/d in 2040. In the Higher Carbon Price Case oil price is projected to increase to $75.00 in 2040, and production is projected to increase to 1.22 million b/d in 2040. In the Higher Carbon Price and Technology Case oil price is projected to increase to $70.00 in 2040, and production is projected to decrease to 1.02 million b/d in 2040. In the Reference and Technology Case oil price is projected to increase to $65.00 in 2040, and production is projected to increase to 1.24 million b/d in 2040. In the High Price Case gas price is projected to increase to $120.00 in 2040, and production is projected to increase to 2.71 million b/d in 2040. In the Low Price Case gas price is projected to decrease to $40.00 in 2040, and production is projected to decrease to 0.36 million b/d in 2040.
Chapter 4 – Final Thoughts
- Oil prices are a key driver of future oil production and a key uncertainty to the projections in EF2017. Crude oil prices could be higher or lower depending on demand trends, technological developments, geopolitical events, and the pace at which nations enact policies to reduce GHG emissions.
- This analysis assumes that over the long term, all energy production will find markets and infrastructure will be built as needed. However, projects to increase oil transportation capacity in North America have proven controversial. Sufficiency of pipeline infrastructure, or oil movements by rail will impact pricing of Canadian crude oil and the economics of production.
- The higher carbon price cases assume that global crude oil prices are lower than the Reference Case. This is uncertain and depends on coordinated global climate action, the responsiveness of oil demand to higher carbon costs, and the availability of alternatives to existing technologies.
- Oil production depends on price, but also on recovery technology and drilling efficiency and costs. Should technology or costs advance differently than assumed, capital expenditures and well production projections would be different than modelled here.
- Thermal recovery of Saskatchewan’s heavy oil resources is a recent trend and future production growth is uncertain. Other technologies may also be adopted.
- Date modified: