ARCHIVED – Canada’s Energy Future 2017 Supplement: Conventional, Tight, and Shale Oil Production – Appendix
This page has been archived on the Web
Information identified as archived is provided for reference, research or recordkeeping purposes. It is not subject to the Government of Canada Web Standards and has not been altered or updated since it was archived. Please contact us to request a format other than those available.
Canada’s Energy Future 2017 Supplement: Conventional, Tight, and Shale Oil Production [PDF 2125 KB]
Appendix Data and Figures [EXCEL 11159 KB]
January 2018
Copyright/Permission to Reproduce
ISSN 2369-1479
Table of Contents
Appendix A
A1 – Methods (Detailed Description)
An oil production projection is the future production capability from a group of wells as determined by the production characteristics of each well, not accounting for reductions in actual production due to weather conditions, low oil prices, equipment failure, or other potential production interruptions. It equals the production capability of a well multiplied by the expected number of wells. The oil price outlook applied to overall production provides the revenue available to the industry. The reinvestment of a portion of the revenue as capital expenditures enables the industry to drill new wells. The capital expenditures divided by the daily cost of drilling provides the number of drill days available in a year. The number of new wells drilled in each year is equal to the number of drill days per year, divided by the number of days required to drill and complete an average well. The projected production performance of an average well is based on historical performance, specifically on how the initial production (IP) rates and decline rates change over time.
For this analysis, western Canada is disaggregated into groupings based on geography and stratigraphy. The number of producing wells and well performance, both historical and projected, are analysed for each grouping. The production projections for all groupings are then summed to determine total western Canadian production. Details on how western Canada is disaggregated into groupings are in Appendix A1.1. The methods used to determine well performance are discussed in Appendix A1.2. The results for each grouping, including IP rates and decline parameters, are in Appendix B and Appendix C.
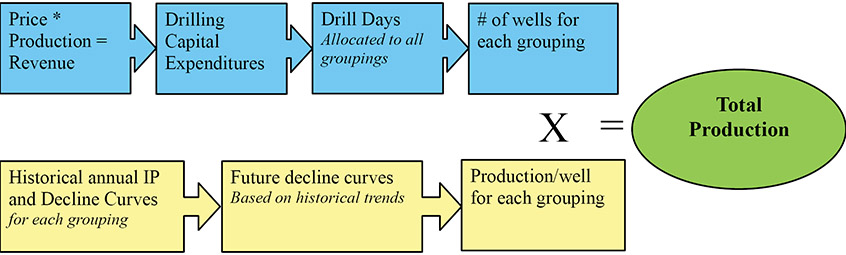
Figure A1.1 – Overall Method
Description:
This illustration shows how total production is calculated. For a given year, price multiplied with production equals revenue. An assumed amount of that revenue is used as drilling capital expenditures. The cost per drill day for that year is divided into the drilling expenditures to get the total number of drill days, which are then allocated to each of the oil groupings to get the number of wells per grouping given the number of drill days to drill a well in each grouping. To get production per well the historical IP and decline curves for each grouping are used to get future IP and decline curves for the given year. Finally, the number of wells multiplied with the production per well equals the production per grouping and total production is the sum of production from all groupings.
A1.1 Groupings for Production Decline Analysis
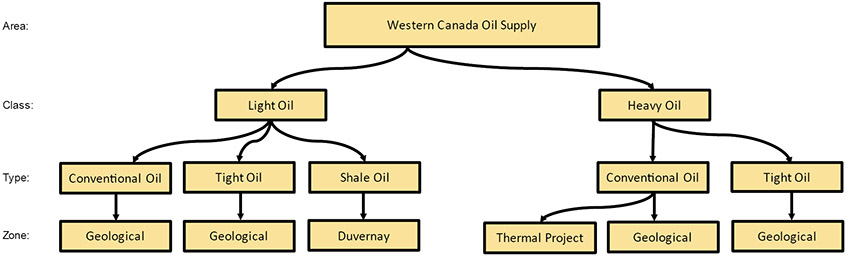
To assess oil deliverability for western Canada, oil production and wells are split into various categories as shown in Figure A1.2. Splitting out western Canada by area, class, type, and grouped geological formations resulted in 250 total groupings, which are listed in Appendix A3.2. Of the 250 groupings, approximately 150 have, or have had, producing wells and thus historical production. The remaining groupings are placeholders for potential future development.
Figure A1.2 – Western Canada Oil Supply Categories for Oil Production Projection
Description:
This illustration shows the categories of western Canada oil production. Oil is broken down by class – either light or heavy. It is then broken down by type of oil – either conventional, tight, or shale. It is then broken down by geological zone to get groupings. Conventional oil is also split out for EOR projects. Shale oil is only produced from the Duvernay resource.
A1.1.1 Oil Areas
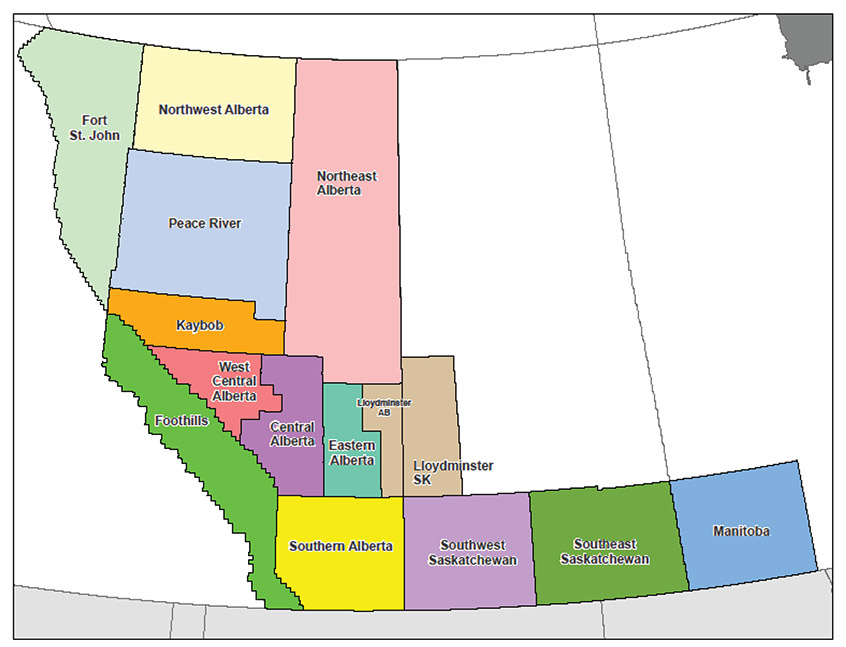
Oil wells and production are grouped geographically based on petroCUBEFootnote 1 areas for Alberta, B.C., Saskatchewan, and Manitoba, as shown in Figure A1.3. The Lloydminster area is further broken down by province. There are 10 areas in Alberta and three in Saskatchewan. Northeast BC is considered one area, as is Southwest Manitoba.
Figure A1.3 – Western Canada Oil Areas Map
Description:
This map shows the western Canadian oil areas. There is one area in northeast British Columbia, 10 areas in Alberta, three areas in southern Saskatchewan, and one area in southwest Manitoba.
A1.1.2 Class – Light or Heavy
Each provincial regulator has its own criteria for classifying crude oil as light, heavy, extra-heavy, or medium. For this report, consistent with NEB practice, oil production has been categorized into only two classes: light and heavy.
B.C. and Alberta oil production with a density of less than 900 kg/m3 (25.6 APIFootnote 2) is classified as light, and oil with a density of more than 900 kg/m3 is classified as heavy. If the density information is missing for a well, it is classified based on other wells in the same pool. Based on the well data, all oil produced in B.C. has, and will be, light oil.
The classification of Saskatchewan oil wells is based on their oil density and geographic area. Lloydminster wells have historically been classified by the Saskatchewan regulator as heavy when their oil production has a density greater than 945 kg/m3 (18.1 API). Light oil in the Kindersley area has a density ranging between 840 and 875 kg/m3 (36.8 and 30.1 API) while heavy oil in this area ranges between 949 and 996 kg/m3 (17.5 and 10.4 API). Swift Current area wells with oil production densities ranging between 885 and 997 kg/m3 (28.2 and 10.3 API), are classified as medium by the provincial regulator, but for this report they are classified as heavy for greater consistency with the categories of other provinces. Oil wells in the Estevan/Weyburn area that are classified as light by the provincial regulator were also classified as light in this report, and have oil densities ranging from 760 to 896 kg/m3 (54.5 and 26.3 API). Estevan/Weyburn wells classified as medium by the provincial regulator are classified in this report as heavy if the well is a conventional oil well and light if the well is a tight oil well because crude oil developed like tight oil in Saskatchewan tends to be on the much lighter side of medium (see section A1.1.2 for information on well types). Historically, these wells have had oil densities ranging from 827 to 956 kg/m3 (39.4 to 16.4 API). Wells with missing classification or density information are classified as light or heavy based on the area.
All oil wells in Manitoba are classified as light. Oil densities in Manitoba have ranged between 838 and 903 kg/m3 (37.2 and 25.0 API).
A1.1.3 Type – Conventional, Tight or Shale
Once an oil well is classified as light or heavy, it is further categorized as either conventional, tight, or shale.
An oil well is classified as tight if it is a horizontal well that produces from the following formations and was drilled after a certain date:
- Bakken/Three Forks/Torquay: after 2004; MB, SK (Estevan) or AB; Bakken,Torquay and Exshaw Formations,
- Beaverhill: after 2008 in AB; Beaverhill Lake Group or Swan Hills Formation (not the Slave Point Formation),
- Belly River: after 2009 in AB; Belly River Group,
- Cardium: after 2007 in AB; Cardium Formation,
- Charlie Lake: after 2008 in AB; Charlie Lake, Halfway, and Boundary Formations,
- Dunvegan: after 2009 in AB; Dunvegan Formation,
- Lower Shaunavon: after 2005 in SK, Shaunavon Formation,
- Montney/Doig: after 2008 in AB and after 2010 in BC; Montney, Doig, or Triassic Formations,
- Pekisko: after 2008 in AB; Pekisko Formation,
- Slave Point: after 2008 in AB; Slave Point Formation,
- Spearfish: after 2008 in MB; Lower Amaranth Formation,
- Viking: after 2007 in SK and AB; Viking Formation.
An oil well is considered shale oil if it is horizontal, drilled after 2007 in Alberta and is producing from the Duvernay Formation.
A1.1.4 Zone – Formation Groups
There are thousands of stratigraphic horizons identified in the well data from the WCSB. This report aggregates these horizons into broader geologic zones, or groupings of formations. The geologic zones are:
- Tertiary
- Upper Cretaceous
- Upper Colorado
- Colorado
- Upper Mannville
- Middle Mannville
- Lower Mannville
- Jurassic
- Upper Triassic
- Lower Triassic
- Permian
- Mississippian
- Upper Devonian
- Middle Devonian
- Lower Devonian
- Siluro/Ordivician
- Cambrian
- PreCambrian
These geologic zones may be further aggregated into groupings of particular formations, based on criteria such as the area, similar well characteristics or number of wells.
Within each grouping, oil wells were grouped by well year, with all wells drilled prior to 1999 forming a single group, and separate yearly classifications for each year from 1999 and on. Thus, for each grouping, average well performance can by analysed over time to see how IP rates and declines change as the resource is developed and as technology evolves.
A1.1.5 Enhanced Oil Recovery Projects
There are at least ten thermal projects in Saskatchewan in Area 12, two CO2-EOR projects in Area 14 in Saskatchewan and one in Area 10 in Northwest Alberta. Each of these projects are identified as separate groupings in the analysis. Since these methods of oil extraction are more ‘project-based’, wells that are identified as part of these projects are not included in the overall decline analysis. Instead, oil production projections for these projects are based on recent production trends as well as producer plans for continued development.
Each of the thermal projects produces heavy, conventional oil from the Mannville Group. The thermal projects are:
- Senlac
- Onion Lake
- Celtic GP/Sparky
- Rush Lake
- Lashburn
- Pikes Peak
- Pikes Peak South
- Plover Lake
- Sandall
- Bolney/Celtic
The CO2-EOR projects in Saskatchewan produce heavy, conventional oil from the Mississippian zone. The Alberta project produces light, conventional oil from the Mississippian and Devonian zones. The Saskatchewan and Alberta CO2-EOR projects are:
- Weyburn (Area 14)
- Midale (Area 14)
- Zama (Area 10)
There are other existing and potential EOR projects in western Canada that may be analysed as individual groupings in future editions of this report.
A1.1.6 Oil Production from Gas Wells
Oil production from natural gas wells is minimal. In Alberta, less than two per cent of conventional and tight oil production comes from gas wells. Since all wells producing oil are included in the existing well analysis, projected oil production from gas wells is embedded in the group projections. Oil production from future gas wells is not directly projected. Analysis of condensate production is included in a separate analysis in the EF2017 report.
A1.2 Oil Well Performance Methods
For this report, historical production data was analysed to determine production declines which were then used to determine future performance. In some cases, newer tight and shale oil development historical data is more limited and production decline trends are not as established. Information gathered during consultations with industry, when possible, and from publicly available data played a larger role in establishing expected well performance for these newer tight and shale oil groupings.
The analysis includes wells drilled since 2000, which creates a large dataset of historical well production trends. The methods applied to project oil production for existing wells differ from those used to project oil production for future wells.
Historical production data is analysed to determine production declines for each grouping (oil area/class/type/zone/well year) to develop two sets of parameters:
- Group decline parameters-- describing production expectations for the entire oil grouping.
- Average well decline parameters-- describing production expectations for the average oil well in the grouping for each year.
The group decline parameters and average well decline parameters resulting from this analysis are contained in Appendices A3.3, A4.1, and A4.2, respectively.
Oil wells are grouped by area, class, type, geological zone, and well year. For each of these groupings, a data set of oil production history is created and, a data set of average well production history is also generated.
The data sets used to estimate group decline parameters are generated by the following:
- Oil production in each grouping is summed to estimate total group oil production (b/d) by calendar month.
- Using this data set, plots of the total daily oil production rate versus total cumulative oil production are generated for each grouping.
The data sets used to determine average well decline parameters are generated by the following:
- The historical, monthly oil production for each well in the grouping is put in a database.
- For each well, the production months are normalized such that the month the well started producing becomes the first production month.
- The total oil production by normalized production month is then divided by the total number of wells in the grouping to determine normalized, monthly oil production for the average well.
- The normalized, monthly oil production is then divided by the average number of days in a month, or 30.4375, to determine the daily production rates for the average well in the grouping.
- Using this data set, plots of the daily oil production rate versus cumulative oil production for the average well were generated for each grouping.
After the average well’s historical production for each grouping and year is determined, each average well is evaluated in sequence, from 2000 through 2016.
a) Production Decline Analysis for the Average Well:
For each well year, the daily rate versus cumulative production plot for the average well is evaluated first to establish:
- Initial Production Rate
- First Decline Rate
- Second Decline Rate
- Months to Second Decline Rate – usually around seven months
- Third Decline Rate
- Months to Third Decline Rate – usually around 25 months
- Fourth Decline Rate
- Months to Fourth Decline Rate – usually around 45 months
- Fifth Decline Rate
- Months to Fifth Decline Rate – usually around 90 months.
Figure A1.4 shows an example of the plots used to evaluate average well performance, and the different decline rates that are applied to describe the production.
Figure A1.4 – Example of an Average Well Production Decline Analysis Plot
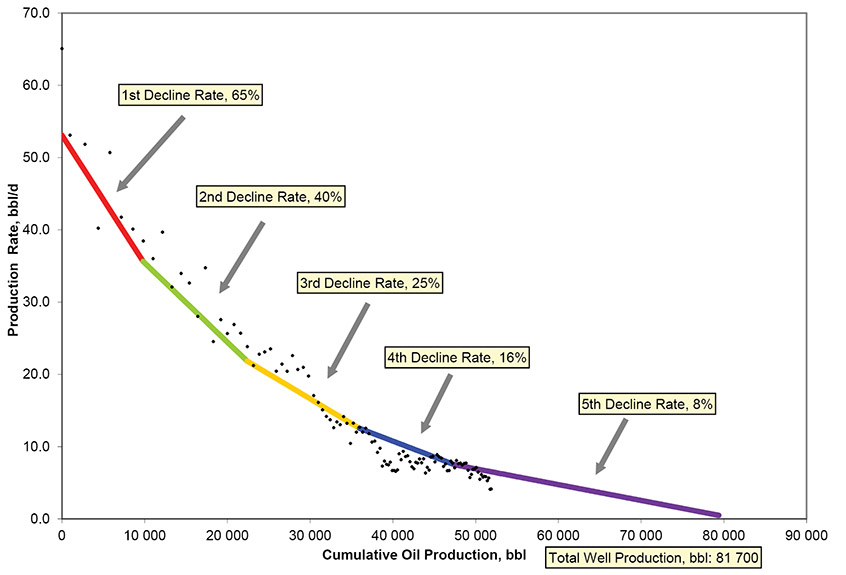
Description:
This graph shows an example of a decline curve for an average oil well. The initial production rate in the first month is 65.1 b/d. For the first seven months the well production rate has a decline rate of 65%. The second decline rate is 40%, the third is 25%, the fourth is 16% and the final decline rate is 8%. Total well production is 81 700 barrels.
“Older” average wells usually have sufficient data to establish all of the above parameters. However, “younger” average wells have historical production data of shorter duration. Therefore, the projected long-term performance of a “younger” average well is assumed to be similar to the historical long-term performance of an “older” average well. In Figure A1.4, the available data is sufficient to determine parameters defining the first, second, third, and fourth decline periods for the well, but the parameters defining the fifth decline period must be assumed based on the analysis of earlier well years.
The estimated decline parameters for average wells are available in Appendix A4.
b) Production Decline Analysis for the Grouped Data:
Performance parameters for an average well are used to calculate the expected group performance. If the data calculated from average well performance data does not provide a good match with the actual historical production data for the group, then the average well parameters may be revised until a good match is obtained between calculated group production data (from average well data) and actual group production data. An example is shown in Figure A1.5.
Figure A1.5 – Example of a Group Production Decline Analysis Plot
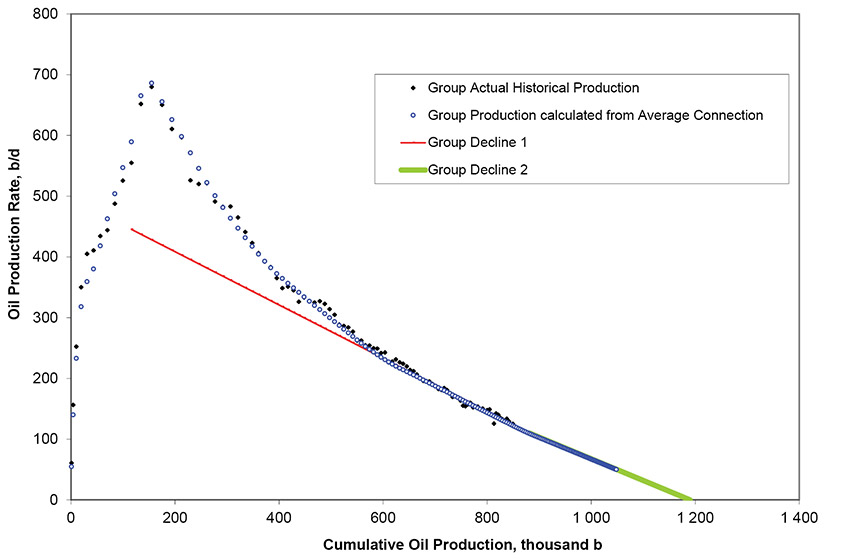
Description:
This graph shows an example of a decline curve for a group of wells. The peak production rate occurs in month 13 and is 679.9 b/d.
The following group performance parameters are determined from the plot of calculated and actual production:
- Production Rate as of December 2014
- First Decline Rate
- Second Decline Rate (if applicable)
- Months to Second Decline Rate (if applicable)
- Third Decline Rate (if applicable)
- Months to Third Decline Rate (if applicable)
- Fourth Decline Rate (if applicable)
- Months to Fourth Decline Rate (if applicable)
- Fifth Decline Rate (if applicable)
- Months to Fifth Decline Rate (if applicable)
A1.2.1 Methods for Existing Wells
In this report, “existing wells” are those brought on production prior to 1 January 2017. Group decline parameters are used to project oil production for existing wells.
In groupings of older wells (2001, 2002, etc.), actual group production from recent years is usually stabilized or is near the terminal decline rate established by the pre-1999 aggregate grouping. In these cases, a single decline rate sufficiently describes the entire remaining productive life of the grouping and the expected performance of the calculated average well has little influence over determination of the group parameters.
In groupings of wells drilled more recently (2014, 2015, etc.), actual group production history data is unlikely to provide a good basis upon which to project future oil production. In these cases, the expected performance of the average well is more speculative with respect to the applicable current and future decline rates.
Group performance parameters are available in Appendix A3.3.
A1.2.2 Methods for Future Wells
In this report, “future wells” are those brought on production from 1 January 2017 onwards. For future wells, projected oil production is based on the number of future wells to be drilled and the expected average performance characteristics of those wells. Historical trends in average well performance, obtained from production decline analysis of existing oil wells, are used to estimate average well performance for future wells.
A1.2.2.1 Performance of Future Wells
The performance of future wells is obtained for each oil grouping by extrapolating the production performance trends for average wells in past years, namely initial productivity of the average well and its associated decline rates.
In some groupings, the initial productivity of the average oil well decreases over time. Recently however, some conventional and tight groupings have average oil wells with initial productivity which has been increasing due to technology, as displayed in Figure A1.6. This graph shows the IP rates for oil wells in the Peace River Light, Tight, Colorado, Mannville, Jurassic, Triassic grouping. The IP rate for future oil wells is estimated by extrapolating the trend in each oil grouping, taking into account technological trends and possible recovery constraints. Historical and projected initial productivities for average wells for future oil groupings are in Appendix A4.1 and A4.2.
Figure A1.6 – Example of Initial Productivity of Average Well by Year - Peace River Light Tight Colorado-Mannville-Jurassic-Triassic Grouping
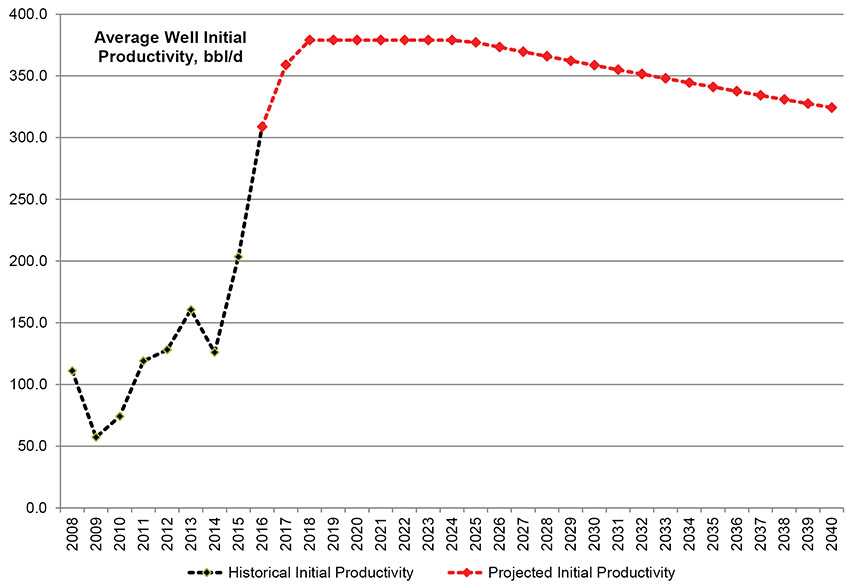
Description:
This graph shows the IP by well year for the Peace River light, tight, Colorado, Mannville, Jurassic, and Triassic grouping. Wells drilled in 2009 had the lowest average IP rate at 57.3 b/d. Wells drilled in 2016 had an average IP of 308.8 b/d. The average IP of wells is projected to increase to 324.3 b/d in 2040.
The key decline parameters for near-term production projections are the first decline rate, second decline rate, and the months elapsed to reach the second decline rate. Figure A1.7 shows the historical and projected values of these parameters for the average Eastern Alberta heavy, conventional, upper Mannville well. As shown in Figure A1.7, trends in past well years are used to establish parameters for future years.
Figure A1.7 – Example of Key Decline Parameters for Average Wells over time - Eastern Alberta Heavy Conventional Upper Mannville Grouping
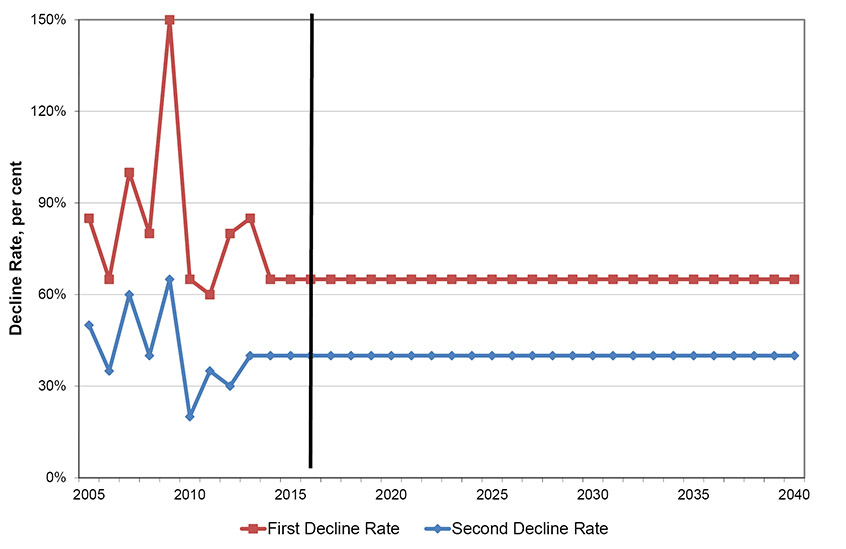
Description:
This graph shows the first and second decline rates by well year for the Eastern Alberta heavy, conventional, upper Mannville grouping. From 2005 to 2016 the first decline rate ranged between 60% and 150%. The projected rate is 65% for all well years. From 2005 to 2016 the second decline rate ranged between 20% and 65%. The projected rate is 40% for all well years.
A1.2.2.2 Number of Future Wells
Projecting the number of future wells requires an estimate of the annual number of oil wells to be drilled and placed into production for each grouping.
Figure A1.8 is the flowchart describing the methodology for projecting the number of oil wells for each year over the projection period. The key inputs are Annual Drilling Investment, Costs per Drill Day and Days to Drill a Well. Adjustments to these three key inputs (shown as yellow boxes in Figure A1.8) produce different projections of drilling activity in the WCSB. Other required inputs are shown in the green boxes in Figure A1.8. The values for these other inputs are estimated from an analysis of historical data.
For the projection, the Board allocates oil drill days between each of the oil groupings. The allocation fractions are determined from historical trends and the Board’s projection of development potential for each of the groupings. Recently, the allocation fractions reflect the historical trends of an increasing focus on deeper formations and increasing development of tight oil plays and the Duvernay Shale. Tables of the historical data (drill days and allocation fractions) and the projected allocation fractions are available in Appendix B.
The number of oil wells drilled in each year for a grouping is calculated by dividing the drill days targeting that grouping, by the average number of drill days per well.
Figure A1.8 – Flowchart of Drilling Projection Method
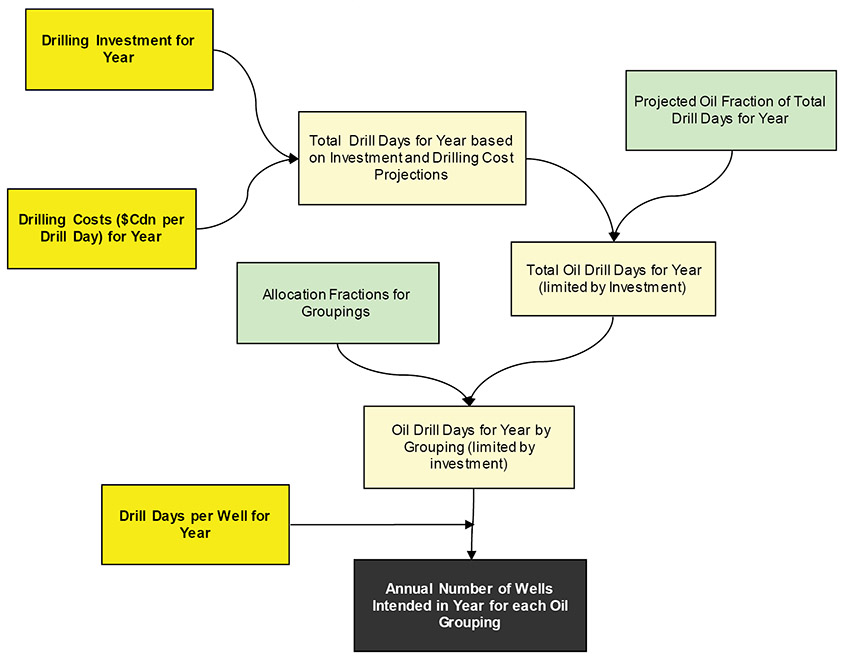
Description:
This illustration also shows how the number of wells is calculated. For a given year, an assumed amount of revenue is used as drilling capital expenditures. The cost per drill day for that year is divided into the drilling expenditures to get the total number of drill days, which are then allocation to each of the oil groupings to get the number of wells per grouping given the number of drill days to drill a well in each grouping.
Appendix 2 - Decline Parameters – Results
A2.1 Production from Existing Oil Wells
The decline parameters describing the expected future production of each grouping are in Appendix A3.3.
The parameters describing future production for all of these groupings are the production rate as of December 2016 and as many as five future decline rates that apply to specified timeframes in the future. For the older groupings of wells, where production appears to have stabilized at a final decline rate, only one future decline rate is needed to describe future group production. For newer wells, the decline rate that applies over future months changes as the group performance progresses towards the final stable decline period. For these newer well groupings, three to four different decline rates have been determined to describe future performance.
The future production projected for these groupings represents the production that would occur from the WCSB if no further oil wells were added after 2016.
A2.2 Production from Future Oil Wells
While production projections for existing oil wells are more predictable, production projections for future oil wells are much less so. The key uncertainty is the level of oil drilling that will occur. Various cases are analysed to address the uncertainty inherent in the oil drilling projections.
A2.2.1 Performance Parameters for Future Average Oil Wells
The overall trend for initial productivity of the average oil well in the WCSB is shown in Figure A2.1. Between 2002 and 2007, initial productivity decreased as conventional resources matured, however the trend reversed upward from 2008 to 2015 given the focus on deeper resources. The average IP dropped in 2016 as a result of increased number of shallower wells (which have lower productivity rates) drilled in SK; stays level until 2025; and then starts to decline slowly as the resource matures and there are fewer sweet spots to target.
Figure A2.1 – Average Initial Productivity of all WCSB Oil Wells by Well Year
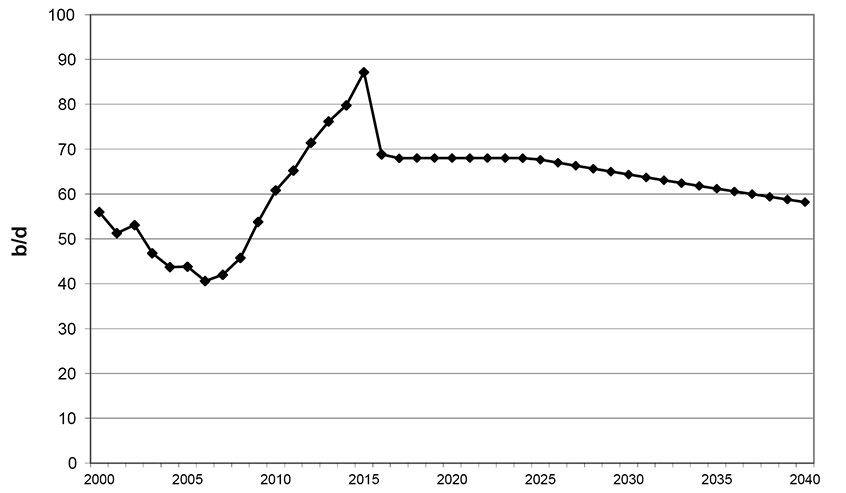
Description:
This illustration also shows how the number of wells is calculated. For a given year, an assumed amount of revenue is used as drilling capital expenditures. The cost per drill day for that year is divided into the drilling expenditures to get the total number of drill days, which are then allocation to each of the oil groupings to get the number of wells per grouping given the number of drill days to drill a well in each grouping.
Table A2.1 shows the historical average IP rates for the average oil wells for each area.
Projected average well performance is the same in all six cases assessed for this report. Overall production varies between the cases as a result of differing levels of oil drilling activity, as discussed further in the next section.
A2.2.2 Number of Future Oil Wells
Drilling activity in a case depends on the assumed oil prices in that case. Figure A2.2 indicates the projected number of oil wells for all groupings in each case.
Appendix B contains detailed tabulations of projected annual oil drill days and oil wells for each grouping, by case.
Figure A2.2 – Oil Wells by Case
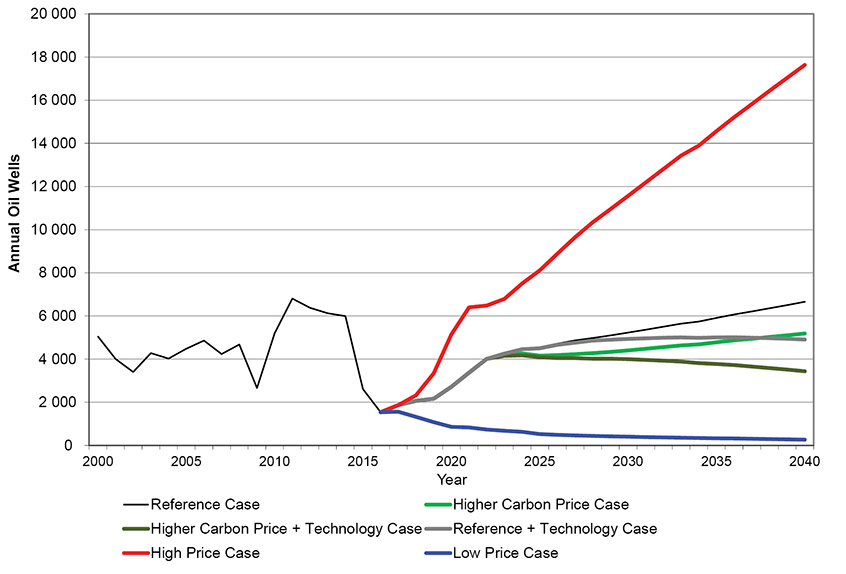
Description:
This graph shows the projected number of conventional, tight, and shale oil wells by year for all six cases. In 2000 there were 5 047 wells, and that increased and peaked in 2011 at 6 803 wells. Since then the number of wells decreased and was at 1 540 in 2016. In the Reference Case the number of wells is projected to increase to 6 654 in 2040. In the Higher Carbon Price Case the number of wells is projected to increase to 5 183 in 2040. In the Higher Carbon Price and Technology Case the number of wells is projected to increase to 3434 in 2040. In the Reference and Technology Case the number of wells is projected to increase to 4 906 in 2040. In the High Price Case the number of wells is projected to increase to 17 637 in 2040. In the Low Price Case the number of wells is projected to decrease to 265 in 2040.
A2.3 Thermal and CO2 Oil Projects
As indicated in Appendix A1.1.5, oil production projections for the thermal and CO2 enhanced oil recovery (EOR) projects are based on extrapolation of prior trends and currently announced plans of producers. Production from EOR projects in SK grows substantially over the projection.
Appendix 3 – Indexes and Decl2ne Parameters for Groupings of Existing Oil Wells
Table A3.1 – Formation Index
| Formation | Abbreviation | Group Number |
|---|---|---|
| Tertiary | Tert | 02 |
| Upper Cretaceous | UprCret | 03 |
| Upper Colorado | UprCol | 04 |
| Colorado | Colr | 05 |
| Upper Mannville | UprMnvl | 06 |
| Middle Mannville | MdlMnvl | 07 |
| Lower Mannville | LwrMnvl | 08 |
| Mannville | Mnvl | 06;07;08 |
| Jurassic | Jur | 09 |
| Upper Triassic | UprTri | 10 |
| Lower Triassic | LwrTri | 11 |
| Triassic | Tri | 10;11 |
| Permian | Perm | 12 |
| Mississippian | Miss | 13 |
| Upper Devonian | UprDvn | 14 |
| Middle Devonian | MdlDvn | 15 |
| Lower Devonian | LwrDvn | 16 |
| Siluro/Ordivician | Sil | 17 |
| Cambrian | Camb | 18 |
| PreCambrian | PreCamb | 19 |
Table A3.2 – Grouping Index
| Area Name | Area Number | Resource Class | Resource Type | Resource Group |
|---|---|---|---|---|
| Southern Alberta | 01 | Heavy | Conventional | 03;04;05;06 |
| Southern Alberta | 01 | Heavy | Conventional | 07 |
| Southern Alberta | 01 | Heavy | Conventional | 08 |
| Southern Alberta | 01 | Heavy | Conventional | 09;10 |
| Southern Alberta | 01 | Heavy | Conventional | 13;14;15 |
| Southern Alberta | 01 | Heavy | Tight | 03;04;05;06 |
| Southern Alberta | 01 | Heavy | Tight | 07;08 |
| Southern Alberta | 01 | Heavy | Tight | 09;10 |
| Southern Alberta | 01 | Heavy | Tight | 13;14;15 |
| Southern Alberta | 01 | Light | Conventional | 03;04;05;06 |
| Southern Alberta | 01 | Light | Conventional | 07 |
| Southern Alberta | 01 | Light | Conventional | 08 |
| Southern Alberta | 01 | Light | Conventional | 09;10 |
| Southern Alberta | 01 | Light | Conventional | 13;14;15 |
| Southern Alberta | 01 | Light | Tight | 03;04;05;06 |
| Southern Alberta | 01 | Light | Tight | 07;08;09;10 |
| Southern Alberta | 01 | Light | Tight | 13;14;15 |
| Lloydminster Alberta | 02 | Heavy | Conventional | 03;04;05 |
| Lloydminster Alberta | 02 | Heavy | Conventional | 06 |
| Lloydminster Alberta | 02 | Heavy | Conventional | 07;08 |
| Lloydminster Alberta | 02 | Heavy | Conventional | 13 |
| Lloydminster Alberta | 02 | Heavy | Conventional | 14 |
| Lloydminster Alberta | 02 | Heavy | Tight | 03;04;05;06;07;08 |
| Lloydminster Alberta | 02 | Heavy | Tight | 13;14 |
| Lloydminster Alberta | 02 | Light | Conventional | 03;04;05 |
| Lloydminster Alberta | 02 | Light | Conventional | 06 |
| Lloydminster Alberta | 02 | Light | Conventional | 07;08 |
| Lloydminster Alberta | 02 | Light | Conventional | 13;14 |
| Lloydminster Alberta | 02 | Light | Tight | 03;04;05;06 |
| Lloydminster Alberta | 02 | Light | Tight | 07;08 |
| Lloydminster Alberta | 02 | Light | Tight | 13;14 |
| Eastern Alberta | 03 | Heavy | Conventional | 03;04;05 |
| Eastern Alberta | 03 | Heavy | Conventional | 06 |
| Eastern Alberta | 03 | Heavy | Conventional | 07;08;09;10 |
| Eastern Alberta | 03 | Heavy | Conventional | 13;14;15 |
| Eastern Alberta | 03 | Heavy | Tight | 03;04;05;06 |
| Eastern Alberta | 03 | Heavy | Tight | 07;08;09;10 |
| Eastern Alberta | 03 | Heavy | Tight | 13;14;15 |
| Eastern Alberta | 03 | Light | Conventional | 03;04;05 |
| Eastern Alberta | 03 | Light | Conventional | 06 |
| Eastern Alberta | 03 | Light | Conventional | 07;08;09;10 |
| Eastern Alberta | 03 | Light | Conventional | 13;14;15 |
| Eastern Alberta | 03 | Light | Tight | 03;04;05;06 |
| Eastern Alberta | 03 | Light | Tight | 07;08;09;10 |
| Eastern Alberta | 03 | Light | Tight | 13;14;15 |
| Central Alberta | 04 | Heavy | Conventional | 02;03 |
| Central Alberta | 04 | Heavy | Conventional | 04;05;06 |
| Central Alberta | 04 | Heavy | Conventional | 07;08 |
| Central Alberta | 04 | Heavy | Conventional | 09;10 |
| Central Alberta | 04 | Heavy | Conventional | 13 |
| Central Alberta | 04 | Heavy | Conventional | 14;15 |
| Central Alberta | 04 | Heavy | Tight | 02;03;04;05;06;07;08 |
| Central Alberta | 04 | Heavy | Tight | 09;10 |
| Central Alberta | 04 | Heavy | Tight | 13;14;15 |
| Central Alberta | 04 | Light | Conventional | 02;03 |
| Central Alberta | 04 | Light | Conventional | 04;05;06 |
| Central Alberta | 04 | Light | Conventional | 07;08 |
| Central Alberta | 04 | Light | Conventional | 09;10 |
| Central Alberta | 04 | Light | Conventional | 13 |
| Central Alberta | 04 | Light | Conventional | 14;15 |
| Central Alberta | 04 | Light | Tight | 02;03;04;05;06;07;08 |
| Central Alberta | 04 | Light | Tight | 09;10 |
| Central Alberta | 04 | Light | Tight | 13;14;15 |
| Central Alberta | 04 | Light | Shale | Duvernay |
| West Central Alberta | 05 | Heavy | Conventional | 03 |
| West Central Alberta | 05 | Heavy | Conventional | 04;05;06;07;08 |
| West Central Alberta | 05 | Heavy | Conventional | 09 |
| West Central Alberta | 05 | Heavy | Conventional | 12;13 |
| West Central Alberta | 05 | Heavy | Conventional | 14;15 |
| West Central Alberta | 05 | Heavy | Tight | 03;04;05;06;07;08;09 |
| West Central Alberta | 05 | Heavy | Tight | 12;13;14;15 |
| West Central Alberta | 05 | Light | Conventional | 03 |
| West Central Alberta | 05 | Light | Conventional | 04;05;06;07;08 |
| West Central Alberta | 05 | Light | Conventional | 09 |
| West Central Alberta | 05 | Light | Conventional | 12;13 |
| West Central Alberta | 05 | Light | Conventional | 14;15 |
| West Central Alberta | 05 | Light | Tight | 03 |
| West Central Alberta | 05 | Light | Tight | 04;05 |
| West Central Alberta | 05 | Light | Tight | 06;07;08;09 |
| West Central Alberta | 05 | Light | Tight | 12;13;14;15 |
| West Central Alberta | 05 | Light | Shale | Duvernay |
| Foothills | 06 | Heavy | Conventional | 03;04;05;06;07;08;09 |
| Foothills | 06 | Heavy | Conventional | 13;14 |
| Foothills | 06 | Heavy | Tight | 03;04;05;06;07;08;09 |
| Foothills | 06 | Heavy | Tight | 13;14 |
| Foothills | 06 | Light | Conventional | 03;04;05;06;07;08;09 |
| Foothills | 06 | Light | Conventional | 13;14 |
| Foothills | 06 | Light | Tight | 03;04;05;06;07;08;09 |
| Foothills | 06 | Light | Tight | 13;14 |
| Kaybob | 07 | Heavy | Conventional | 03;04;05;06;07;08 |
| Kaybob | 07 | Heavy | Conventional | 09;10;11;12 |
| Kaybob | 07 | Heavy | Conventional | 13;14;15;16 |
| Kaybob | 07 | Heavy | Tight | 03;04;05;06;07;08 |
| Kaybob | 07 | Heavy | Tight | 09;10;11;12 |
| Kaybob | 07 | Heavy | Tight | 13;14;15;16 |
| Kaybob | 07 | Light | Conventional | 03;04;05;06;07;08 |
| Kaybob | 07 | Light | Conventional | 09;10;11;12 |
| Kaybob | 07 | Light | Conventional | 13;14;15;16 |
| Kaybob | 07 | Light | Tight | 03;04;05;06;07;08 |
| Kaybob | 07 | Light | Tight | 09;10;11;12 |
| Kaybob | 07 | Light | Tight | 13;14;15;16 |
| Kaybob | 07 | Light | Shale | Duvernay |
| Peace River | 08 | Heavy | Conventional | 03;04;05 |
| Peace River | 08 | Heavy | Conventional | 06;07 |
| Peace River | 08 | Heavy | Conventional | 08 |
| Peace River | 08 | Heavy | Conventional | 09;10;11 |
| Peace River | 08 | Heavy | Conventional | 12;13 |
| Peace River | 08 | Heavy | Conventional | 14 |
| Peace River | 08 | Heavy | Conventional | 15 |
| Peace River | 08 | Heavy | Conventional | 16 |
| Peace River | 08 | Heavy | Tight | 03;04;05;06;07;08 |
| Peace River | 08 | Heavy | Tight | 09;10;11 |
| Peace River | 08 | Heavy | Tight | 12;13;14;15;16 |
| Peace River | 08 | Light | Conventional | 03;04 |
| Peace River | 08 | Light | Conventional | 05 |
| Peace River | 08 | Light | Conventional | 06;07 |
| Peace River | 08 | Light | Conventional | 08 |
| Peace River | 08 | Light | Conventional | 09;10;11 |
| Peace River | 08 | Light | Conventional | 12;13 |
| Peace River | 08 | Light | Conventional | 14 |
| Peace River | 08 | Light | Conventional | 15 |
| Peace River | 08 | Light | Conventional | 16 |
| Peace River | 08 | Light | Tight | 03;04 |
| Peace River | 08 | Light | Tight | 05;06;07;08;09;10;11 |
| Peace River | 08 | Light | Tight | 12;13;14;15;16 |
| Northeast Alberta | 09 | Heavy | Conventional | 01;02;03 |
| Northeast Alberta | 09 | Heavy | Conventional | 04;05;06;07;08 |
| Northeast Alberta | 09 | Heavy | Conventional | 14 |
| Northeast Alberta | 09 | Heavy | Tight | 01;02;03 |
| Northeast Alberta | 09 | Heavy | Tight | 04;05;06;07;08 |
| Northeast Alberta | 09 | Heavy | Tight | 14 |
| Northeast Alberta | 09 | Light | Conventional | 01;02;03;04;05;06;07 |
| Northeast Alberta | 09 | Light | Conventional | 08 |
| Northeast Alberta | 09 | Light | Conventional | 14 |
| Northeast Alberta | 09 | Light | Tight | 01;02;03 |
| Northeast Alberta | 09 | Light | Tight | 04;05;06;07;08;14 |
| Northwest Alberta | 10 | Heavy | Conventional | 08;13;14;15 |
| Northwest Alberta | 10 | Heavy | Tight | 08;13;14;15 |
| Northwest Alberta | 10 | Light | Conventional | 08;13;14;15 |
| Northwest Alberta | 10 | Light | Tight | 08;13;14;15 |
| Fort St. John | 11 | Heavy | Conventional | 04;05;06;07;08 |
| Fort St. John | 11 | Heavy | Conventional | 10;11 |
| Fort St. John | 11 | Heavy | Conventional | 12;13;14 |
| Fort St. John | 11 | Heavy | Tight | 04;05;06;07;08 |
| Fort St. John | 11 | Heavy | Tight | 10;11;12;13;14 |
| Fort St. John | 11 | Light | Conventional | 04;05;06;07;08 |
| Fort St. John | 11 | Light | Conventional | 10;11 |
| Fort St. John | 11 | Light | Conventional | 12;13;14 |
| Fort St. John | 11 | Light | Tight | 04;05;06;07;08 |
| Fort St. John | 11 | Light | Tight | 10;11;12;13;14 |
| Lloydminster Saskatchewan | 12 | Heavy | Conventional | 03;04;05 |
| Lloydminster Saskatchewan | 12 | Heavy | Conventional | 06 |
| Lloydminster Saskatchewan | 12 | Heavy | Conventional | Celtic Sparky |
| Lloydminster Saskatchewan | 12 | Heavy | Conventional | Sparky |
| Lloydminster Saskatchewan | 12 | Heavy | Conventional | Lashburn |
| Lloydminster Saskatchewan | 12 | Heavy | Conventional | Pikes Peak |
| Lloydminster Saskatchewan | 12 | Heavy | Conventional | Plover Lake |
| Lloydminster Saskatchewan | 12 | Heavy | Conventional | Sandall Colony |
| Lloydminster Saskatchewan | 12 | Heavy | Conventional | Colony |
| Lloydminster Saskatchewan | 12 | Heavy | Conventional | Bolney |
| Lloydminster Saskatchewan | 12 | Heavy | Conventional | 07;08 |
| Lloydminster Saskatchewan | 12 | Heavy | Conventional | Seniac |
| Lloydminster Saskatchewan | 12 | Heavy | Conventional | Onion |
| Lloydminster Saskatchewan | 12 | Heavy | Conventional | Celtic GP |
| Lloydminster Saskatchewan | 12 | Heavy | Conventional | 13 |
| Lloydminster Saskatchewan | 12 | Heavy | Conventional | 14;15 |
| Lloydminster Saskatchewan | 12 | Heavy | Tight | 03;04;05;06;07;08 |
| Lloydminster Saskatchewan | 12 | Heavy | Tight | 13;14;15 |
| Lloydminster Saskatchewan | 12 | Light | Conventional | 03;04;05;06;07;08 |
| Lloydminster Saskatchewan | 12 | Light | Conventional | 13;14;15 |
| Lloydminster Saskatchewan | 12 | Light | Tight | 03;04;05;06;07;08 |
| Lloydminster Saskatchewan | 12 | Light | Tight | 13;14;15 |
| Southwest Saskatchewan | 13 | Heavy | Conventional | 03;04;05;06;07;08 |
| Southwest Saskatchewan | 13 | Heavy | Conventional | 09;13;14 |
| Southwest Saskatchewan | 13 | Heavy | Tight | 03;04;05;06;07;08 |
| Southwest Saskatchewan | 13 | Heavy | Tight | 09;13;14 |
| Southwest Saskatchewan | 13 | Light | Conventional | 03;04;05;06;07;08;09;13 |
| Southwest Saskatchewan | 13 | Light | Tight | 03;04;05;06;07;08;09;13 |
| Southeast Saskatchewan | 14 | Heavy | Conventional | 06;07;08 |
| Southeast Saskatchewan | 14 | Heavy | Conventional | 09;10;11 |
| Southeast Saskatchewan | 14 | Heavy | Conventional | 13 |
| Southeast Saskatchewan | 14 | Heavy | Conventional | 14;15;16;17;18;19 |
| Southeast Saskatchewan | 14 | Heavy | Tight | 06;07;08;09;10;11 |
| Southeast Saskatchewan | 14 | Heavy | Tight | 13 |
| Southeast Saskatchewan | 14 | Heavy | Tight | 14;15 |
| Southeast Saskatchewan | 14 | Heavy | Tight | 17;18;19 |
| Southeast Saskatchewan | 14 | Light | Conventional | 06;07;08;09;10;11 |
| Southeast Saskatchewan | 14 | Light | Conventional | 13 |
| Southeast Saskatchewan | 14 | Light | Conventional | 14;15 |
| Southeast Saskatchewan | 14 | Light | Conventional | 17;18;19 |
| Southeast Saskatchewan | 14 | Light | Tight | 06;07;08;09;10;11 |
| Southeast Saskatchewan | 14 | Light | Tight | 13 |
| Southeast Saskatchewan | 14 | Light | Tight | 14;15 |
| Southeast Saskatchewan | 14 | Light | Tight | 17;18;19 |
| Manitoba | 15 | Heavy | Conventional | 09;10;11;13;14 |
| Manitoba | 15 | Heavy | Tight | 09;10;11 |
| Manitoba | 15 | Heavy | Tight | 13;14 |
| Manitoba | 15 | Light | Conventional | 09;10;11;13;14 |
| Manitoba | 15 | Light | Tight | 09;10;11;13;14 |
Appendix B and Appendix C, as well as Appendix A3 and Appendix A4, are available here.
- Date modified: