Canada’s Pipeline Transportation System 2016
Trans Mountain Pipeline ULC’s Trans Mountain Pipeline
| Commodity and NEB Group | Crude oil, petroleum products (Group 1) |
| Average annual capacity | 47 700 m³/d (300 Mb/d)Note a |
| Average utilization 2015 | 105% |
| Primary receipt points | Edmonton, AB; Kamloops, BC |
| Primary delivery points | Kamloops, Burnaby, Westridge Dock, BC; Cherry Point, Ferndale, Anacortes, WA |
| Rate base 2015 | $996 million |
| Revenue Requirement 2015 | $293 million |
| Abandonment Cost Estimate and Collection PeriodNote b | $340 million; 40 years |
Overview
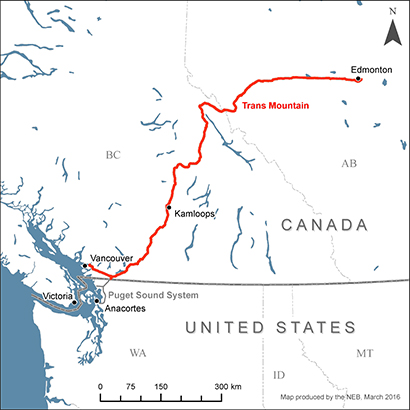
The Trans Mountain Pipeline (Trans Mountain) transports crude oil and refined petroleum products from Edmonton, AB to refineries and terminals in both British Columbia and Washington State. Crude oil is also shipped to offshore markets in Asia and the U.S. west coast via the Trans Mountain Marine Terminal (Westridge Dock) in Burnaby, B.C.
Source: NEB
Text version of this map
This map provides an overview of the Trans Mountain Pipeline System.
Key Developments
In December 2013 Kinder Morgan filed an application for the Trans Mountain Pipeline Expansion project (TMX) and on 19 May 2016, the project was approved by the Board. It would increase the capacity of the Trans Mountain system to 141 500 m³/d (890 Mb/d).
In January 2015, the Board approved tariff amendments which, among other things, incorporated limits for verifying shipper nominations that are based on historical deliveries (RHW-001-2013). Nomination verification was previously based on a shipper’s capability to tender and receive volumes. After an additional comment period, the Board approved a revision of the tariff amendments in April 2015. The amendments contributed to a reduction in apportionment levels on Trans Mountain, which were often above 70% during 2013-2014.
In February 2016, the Board approved the 2016-2018 Incentive Toll Settlement (ITS) for Trans Mountain.
Utilization
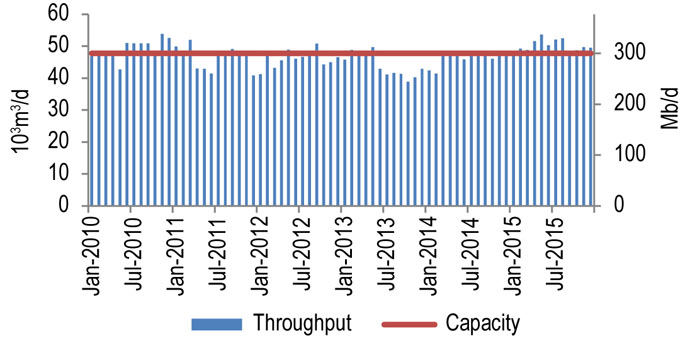
Trans Mountain capacity varies depending on the proportion of heavy and light crude oil transported. Figure 8.3.1 shows a capacity of 47 600 m³/d (300 Mb/d), which assumes 20% heavy crude oil shipped. Capacity is higher if moving less heavy crude oil.
Figure 8.3.1: Trans Mountain Throughput vs. Capacity
Source: Trans Mountain, NEB
Text version of this graphic
This bar chart shows throughput and capacity for the Trans Mountian Pipeline between 2010 and 2015. Capacity in 2015 was 47.6 10³m³/d (300 Mb/d). Throughput averaged 50.3 10³m³/d (316 Mb/d) in 2015, compared to 46.5 10³m³/d (293 Mb/d) in 2014.
In 2014 and 2015, average throughput was 46 500 m³/d (293 Mb/d) and 50 300 m³/d (316 Mb/d), respectively.
High demand for pipeline capacity to the west coast has contributed to apportionment on Trans Mountain and triggered several applications to allocate capacity between Land Shippers (mostly B.C. and Washington State refineries) and Dock Shippers (marine exporters). Currently, approximately 26% of capacity is allocated to the Westridge Dock, including 8 600 m³/d (54 Mb/d) of firm service and 4 000 m³/d (25 Mb/d) of interruptible service which is auctioned each month. The remainder of capacity is allocated to Land Destinations. Average Land Destination apportionment was 70.2% in 2014 and 31.2% in 2015.
Tolls
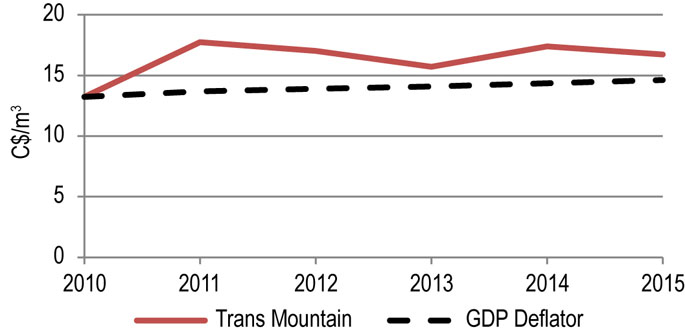
Trans Mountain currently operates under a three-year Incentive Toll Settlement (2016-2018 ITS). Figure 8.3.2 shows the Trans Mountain benchmark toll (light petroleum from Edmonton to Burnaby) along with the GDP deflator (normalized) for 2010 – 2015. Tolls have fluctuated as over or under-recoveries of revenues are transferred to future years.
Figure 8.3.2: Trans Mountain Benchmark Toll
Source: NEB
Text version of this graphic
This graph shows the Trans Mountain benchmark toll as a solid red line and the GDP deflator as a black dashed line. The graph shows the Trans Mountain benchmark toll rising sharply from approximately $13.00 in 2010 to approximately $18.00 in 2011. The toll then decreases steadily to approximately $16.00 till 2013. The toll then increases in 2014 to approximately $17.00 and once again decreases slightly in 2015.
Financial
Trans Mountain has operated under incentive toll agreements since 2013. The 2013-2015 agreement and the 2016-2018 agreement include a baseline return on equity of 9.5%. These agreements incorporate incentives to increase its return through efficiency improvements.
Credit ratings are not available for Kinder Morgan Canada, which owns Trans Mountain Pipeline ULC and represents approximately 2% of its parent company’s (Kinder Morgan Inc.) earnings. Kinder Morgan Canada’s access to debt markets is supported by Kinder Morgan Inc., which, for example, DBRS currently assigns a credit rating of BBB.
| Trans Mountain Pipeline ULC | 2010 | 2011 | 2012 | 2013 | 2014 | 2015 |
|---|---|---|---|---|---|---|
| Revenue requirement (millions) | $221 | $270 | $295 | $275 | $292 | $293 |
| Rate Base (millions) | $1 036 | $1 020 | $996 | $990 | $994 | $1 005 |
| Deemed Equity Ratio | 45% | 45% | 45% | 45% | 45% | 45% |
| Achieved Return on Equity | 10.5% | 9.82% | 9.5% | 8.06% | 8.5% | |

- Date modified: